De-densifying Gauteng: A thought experiment
As we come to grips with the effects of the COVID-19 pandemic, various urban forms and functions are being examined critically by urban scholars and policy makers. One dimension of the urban form that is being fiercely debated is population density. The COVID-19 pandemic has raised concerns that dense urban areas increase the risk of transmission and one of the proposed responses includes de-densifying parts of cities in order to reduce the transmission of the virus. This interactive visualisation represents a thought experiment and an attempt to understand the relationship between density, population size and land area in Gauteng. Additional thoughts on the density debate is published in the May 2020 Map of the Month.
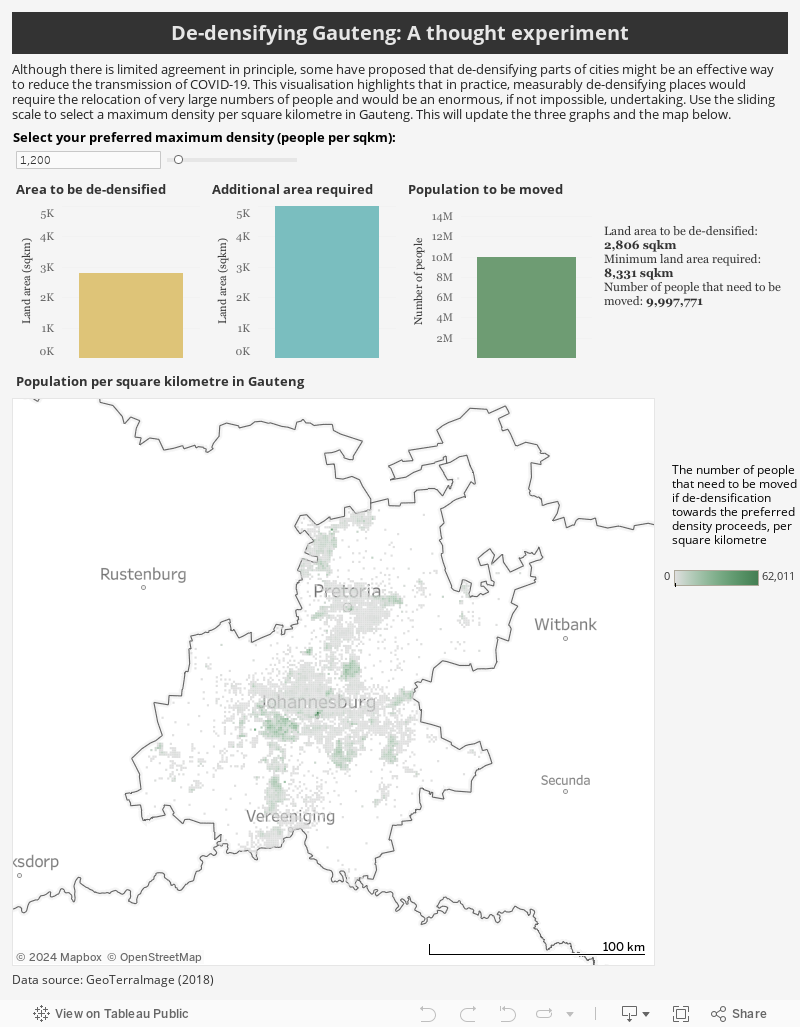
This interactive visualisation considers what it would take to bring population density down to a particular threshold, in terms of the number of people who would need to be moved from densely populated areas and the minimum land area that would be required for their relocation.
The visualisation allows you to use a sliding scale to set hypothetical caps on density (number of people per square kilometre). The visualisation then calculates what it would take to achieve this maximum density across Gauteng, and presents these results in three graphs and a map. The graphs present the following:
- The total land area (km2) in Gauteng where current population density exceeds the selected threshold;
- The total number of people who would need to be moved out of the areas that are more dense than the selected threshold; and
- The total land area required to accommodate those people who would need to be relocated, while maintaining the selected density threshold.
The map is divided into 1km2 blocks, and shows the number of people in each square kilometre block who would need to be moved to achieve the selected density. The darker the colour of a block the more people would need to be moved out of this area to achieve the selected maximum density. Importantly, the map also provides a sense of the spatial scale of the de-densification task. The areas with high densities are spread across the province because most municipalities in the city-region have polycentric urban forms.