Change in exponential growth of confirmed COVID-19 cases in South Africa and Gauteng
South Africa’s battle with the COVID-19 pandemic has been relentless ever since a national disaster was declared on 15 March 2020. On 26 March 2020, the national government implemented a COVID-19 Risk Adjusted Strategy to combat the virus. The strategy included various ‘levels of lockdown’ which were intended to slow down the spread of the virus. The tightest restrictions were in place for a 5-week period under lockdown level 5. Under lockdown level 5, all non-essential movement and activity were prohibited, and essential gatherings (like funerals) were limited to a small number of people. Subsequent lockdown levels relaxed various restrictions and allowed greater flexibility for movement, economic activity, and social interaction.
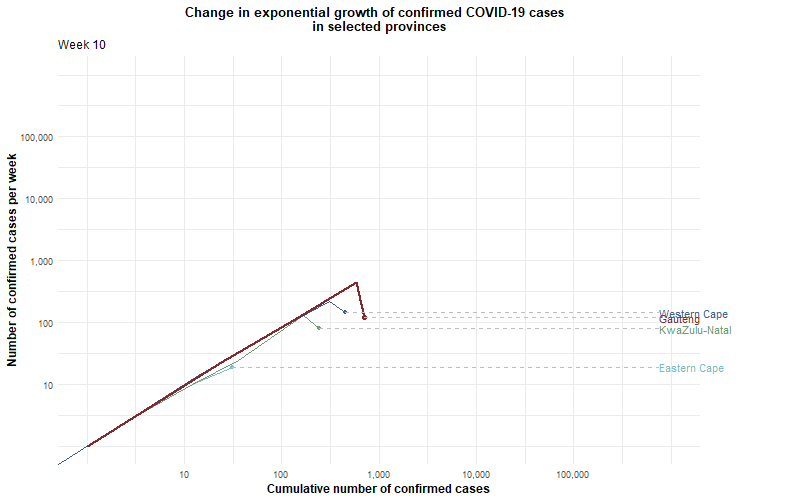
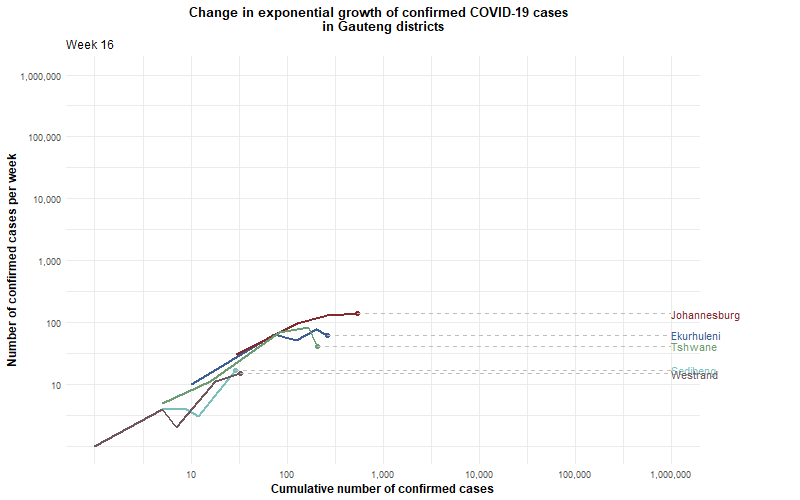
A key part of the COVID-19 Risk Adjusted Strategy is to monitor the spread of the virus and to determine which areas in the country are at higher risk levels than others. The following visualisation achieves this by showing the relationship between the change in confirmed COVID-19 cases per week (y-axis) and the cumulative number of confirmed COVID-19 cases (x-axis). The visualisations are inspired by Aatish Bhatia’s work on the trajectory of confirmed cases by countries around the world, and the method is explained in more detail here.
As the first COVID-19 cases were recorded in South Africa, growth was exponential, as was expected with this virus. This exponential growth (or straight line increase on a logarithmic scale) is evident in all the provinces and districts represented in the visualisations below. When a province or district starts to “beat back” the spread of the virus, the rate of growth starts to deviate from an exponential growth rate.
Selected provinces in South Africa:
- After the initial exponential growth of infections, the rate of increase in all provinces slowed during the week of 30 March-5 April 2020 (week 14) as lockdown level 5 was implemented. During this period, only 144 new cases were recorded in the Western Cape, and only 120 new cases were recorded in Gauteng.
- The rate of increase returned to “exponential” in the Western and Eastern Cape from about the week of 13-19 April 2020 (week 16), albeit with small numbers at first.
- The rate of increase returned to “exponential” in Gauteng from about the week of 25-31 May 2020 (week 22), when 1 230 new cases were reported.
- The rate of increase began to slow in the Western Cape from about the week of 8-14 June 2020 (week 24), while Gauteng continued to increase at an exponential rate until the week of 13-19 July 2020 (week 29).
- The rate of increase slowed in Gauteng, the Eastern Cape and the Western Cape from week 29 (13-19 July 2020), but only from about week 32 in KwaZulu-Natal.
- The rate of increase returned to “exponential’ in the Eastern Cape from about the week of 28 September-4 October 2020 (week 40) and in the Western Cape from about the week of 5-11 October 2020 (week 41).
- In KwaZulu-Natal, the rate of growth increased in week 47 (16-22 November 2020) while the rate of growth remained low in Gauteng, despite Gauteng recording a similar number of new cases since week 47.
- The “second peak” of COVID-19 infections started to decline in the first week of 2021.
- The rate of change remained low until the end of April 2021, when slight increases were evident in most provinces.
- Between the week of 3 May 2021 and the week of 29 June 2021, Gauteng experienced exponential growth rates of COVID-19 cases.
- The growth rates for all provinces have returned to below exponential growth rates.
Districts in Gauteng:
- After the initial exponential growth of infections, the rate of increase in all districts dipped significantly below exponential growth in the week of 30 March-5 April 2020 (week 14) as lockdown level 5 was implemented.
- The rate of increase varied thereafter for a short period, but exponential increases have been evident in all districts since the week of 18-24 May 2020 (week 21).
- The rate of increase has slowed slightly since the week of 6-12 July 2020 (week 28) and continued to slow for the week of 20-26 July 2020 (week 30).
- After the second wave at the end of 2020, the rate of increase for cases in Gauteng decreased since week 9 of 2021 (22 February 2021).
- Between the week of 3 May 2021 and the week of 13 July, the rate of change increased in Gauteng districts.
- Confirmed COVID-19 cases are still increasing in all districts in Gauteng, but currently at a much slower than the exponential growth rate.
- The City of Johannesburg still has the highest number of cumulative cases to date and has the highest number of new cases in the past three weeks.
Data notes:
- The main purpose of the graphs is to show deviations from exponential growth.
- Graph depends on confirmed cases, which in turn depends on testing while protocols and capacities differ across provinces and districts.
- New cases per week are on the y-axis and on a logarithmic scale (log10).
- Cumulative cases are on the x-axis and on a logarithmic scale (log10).
- Time is implied and shown by the animation of the data. The progression during various weeks is indicated in the top left of each graph.
Last updated: 13 September 2021.