Academic outputs using the Quality of Life data
Since 2009, GCRO has conducted five Quality of Life surveys. In this time the survey has grown in the size of the sample and in the number of questions asked. The impact of the survey has also increased with each year and iteration. This is the second in a series of interactive visualisations that explore different aspects of the Quality of Life survey.
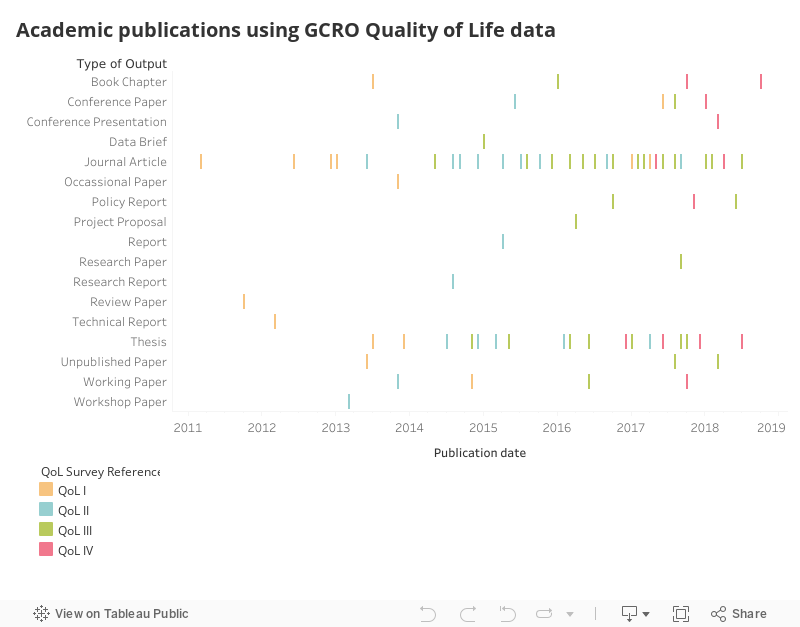
The Quality of Life survey data sets are available for research and non-profit use. The data is widely used both within and beyond the GCRO. This is demonstrated by the number of academic outputs that have drawn on data from the various iterations of the Quality of Life survey. This visualisation presents only a slice of how these data are used. It does not include the many GCRO Maps of the Month, Vignettes or presentations produced by the GCRO.
Click on or hover over each coloured bar to see full details of each publication.